User guide
What every control does, and what every number means.
This covers the basics of using the platform. It explains what you are looking at, not what to do about it - reading a probability well is a separate skill, and one we teach in coaching rather than in a manual.
On this page
1. Running your first analysis
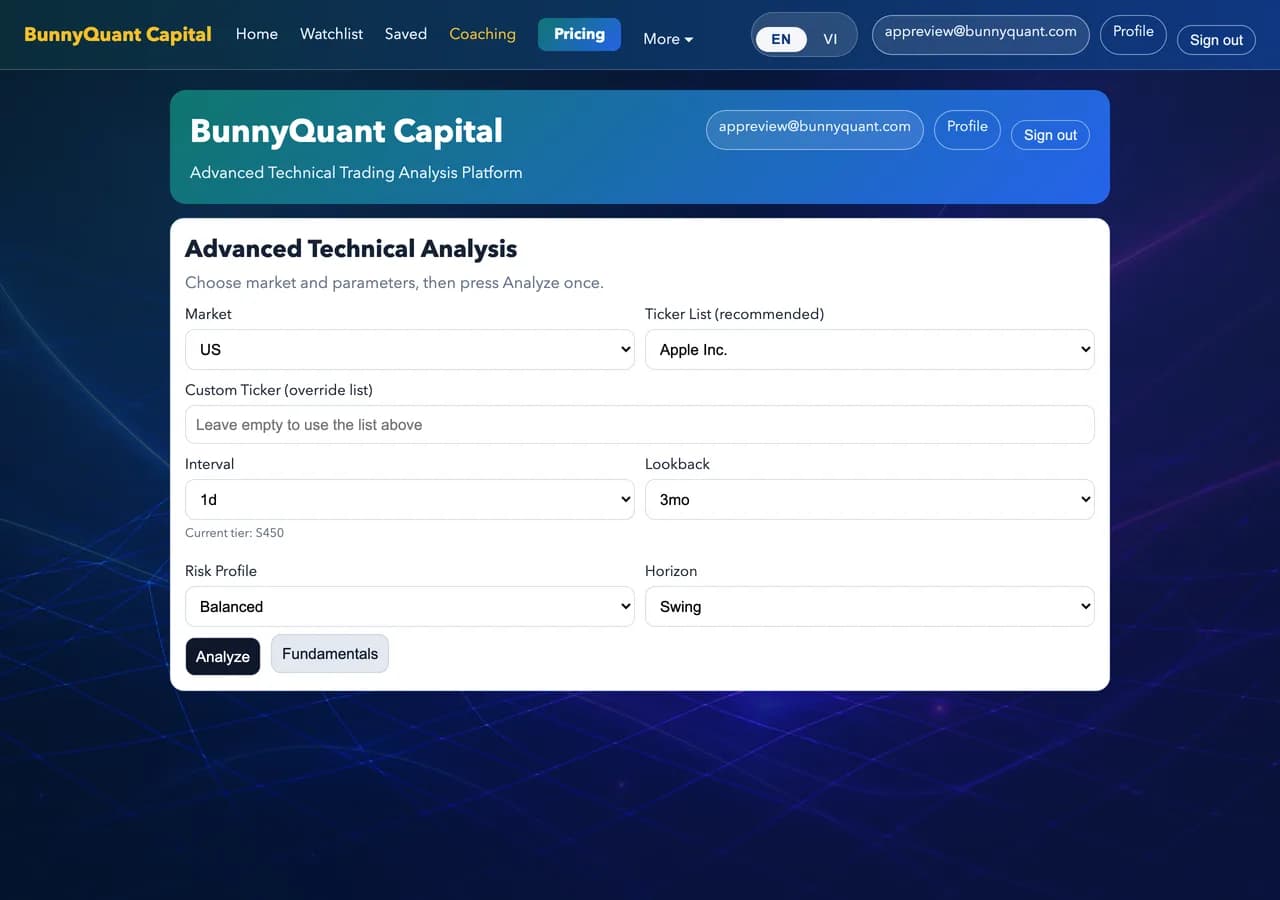
Everything starts on the home page. Pick a market, name an instrument, choose how far back to look, and press Analyze once.
Two ways to name an instrument: choose from the dropdown list, or type any symbol into the Custom Ticker field. The custom field wins if both are filled, and it clears whenever you change market.
- Market
- US equities, crypto, futures, metals, or Vietnam. Which markets you can reach depends on your plan.
- Ticker list
- A short curated list per market. Convenient, not exhaustive.
- Custom Ticker
- Any symbol the data source knows — MNQH26.CME, BTC-USD, VCB. Leave it empty to use the list.
- Interval
- The bar size. Locked entries are ones your plan does not include.
- Lookback
- How much history to read. Longer is steadier; shorter reacts faster.
- Risk profile
- Shifts how conservative the position sizing is.
- Horizon
- Intraday, swing or position. Changes which timeframes carry the most weight.
2. Reading the decision
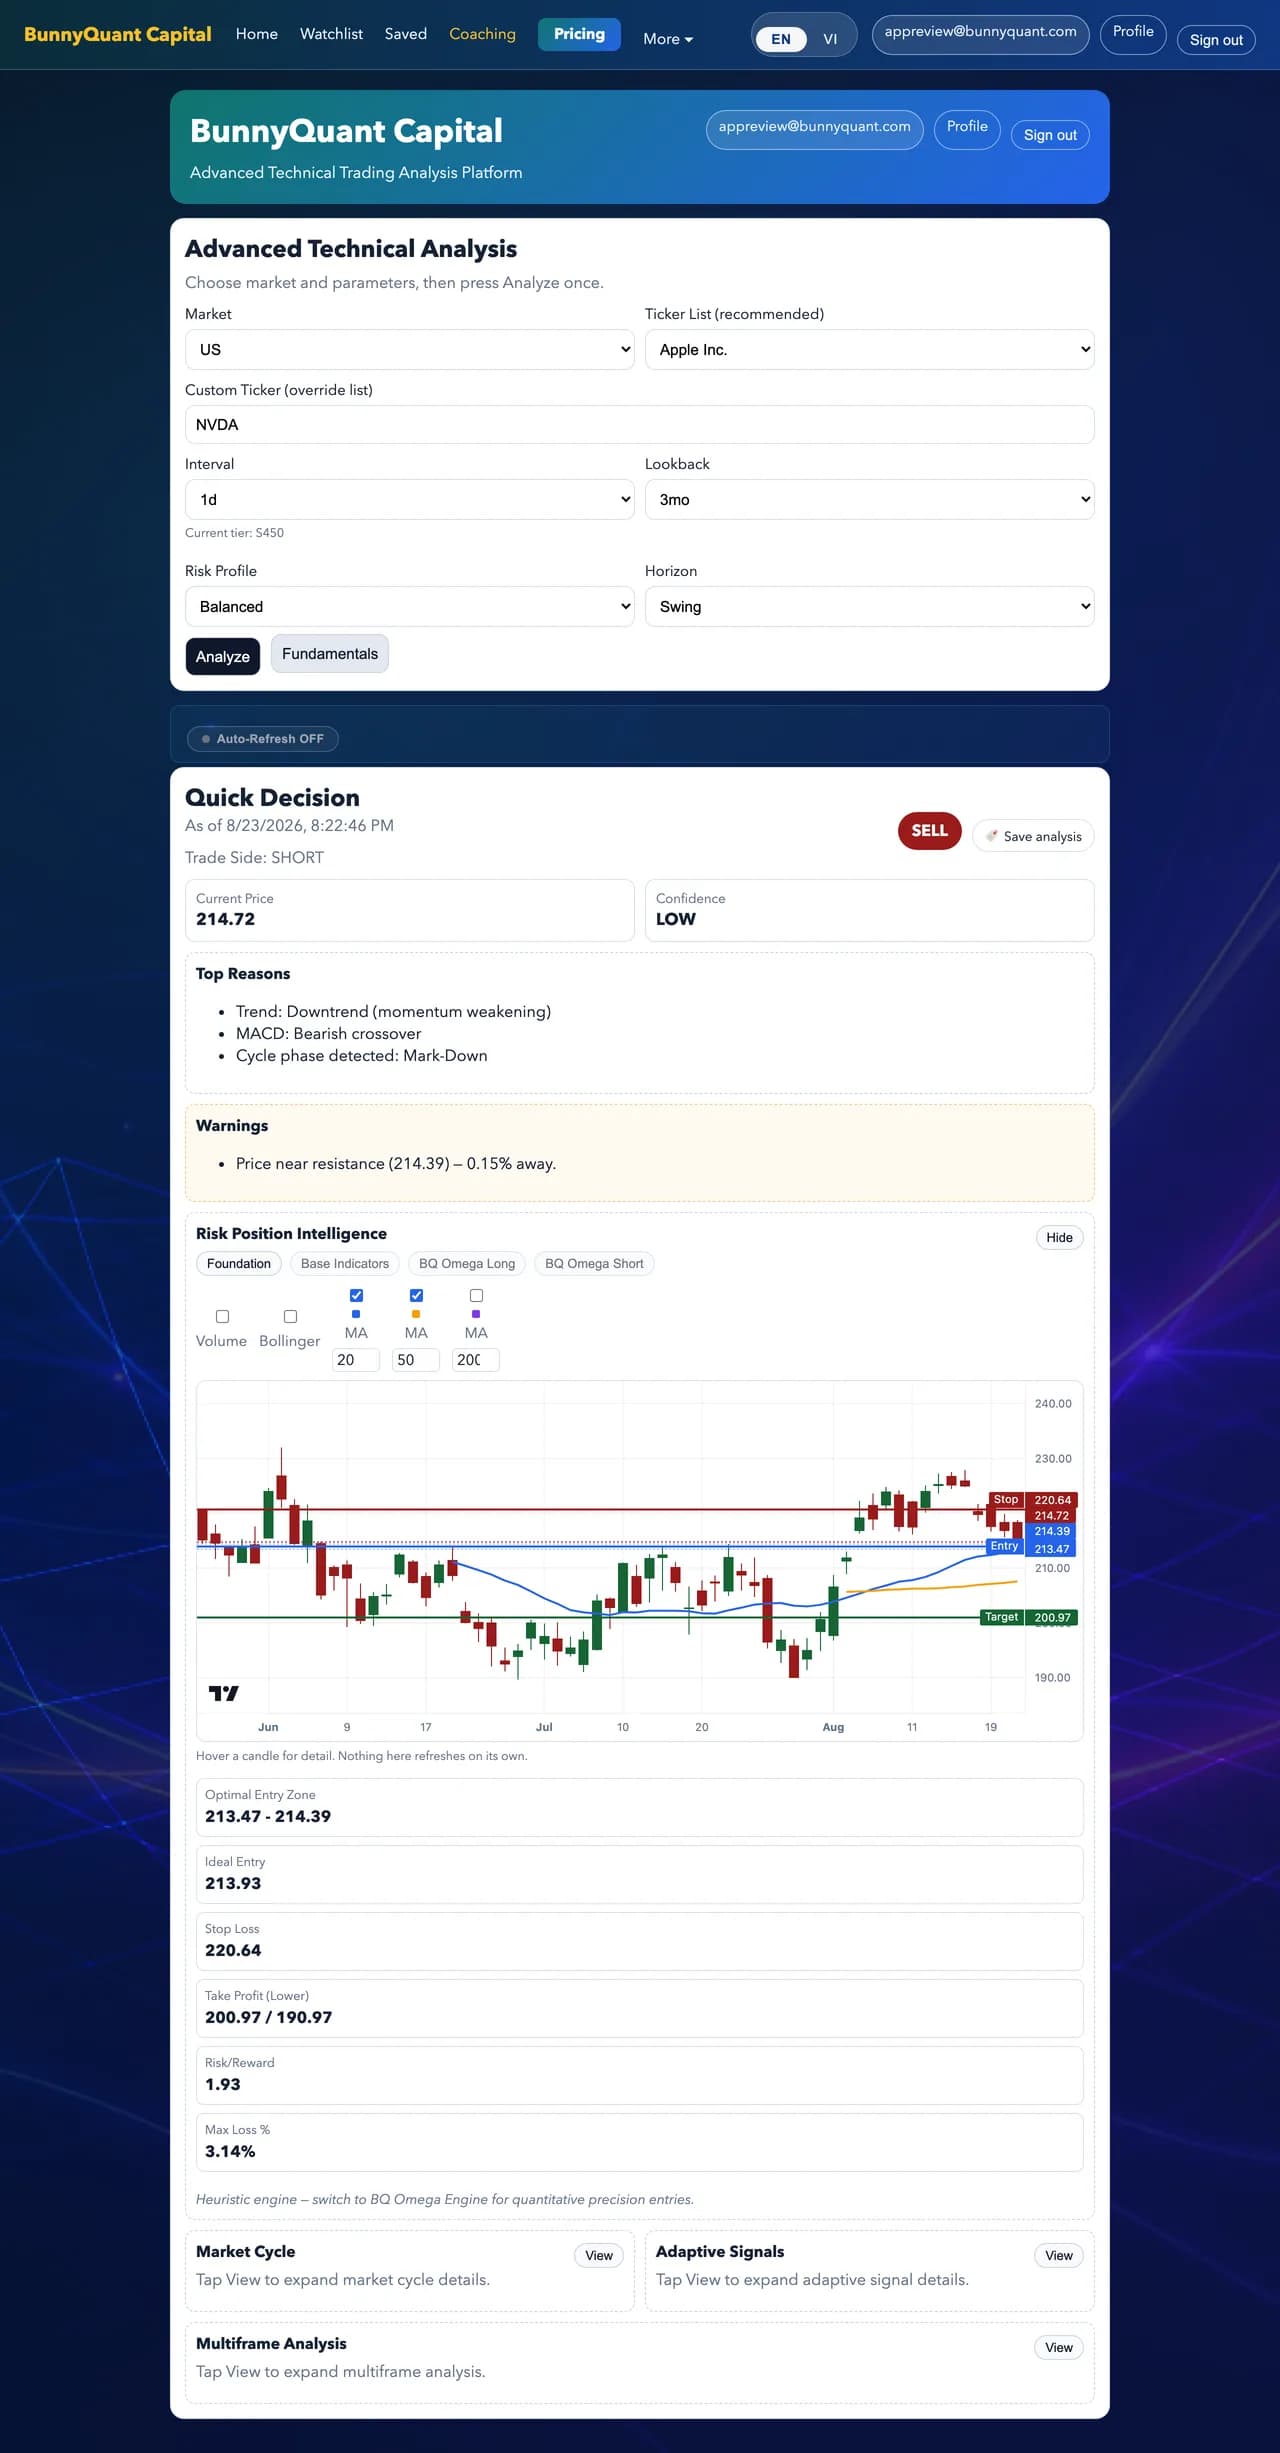
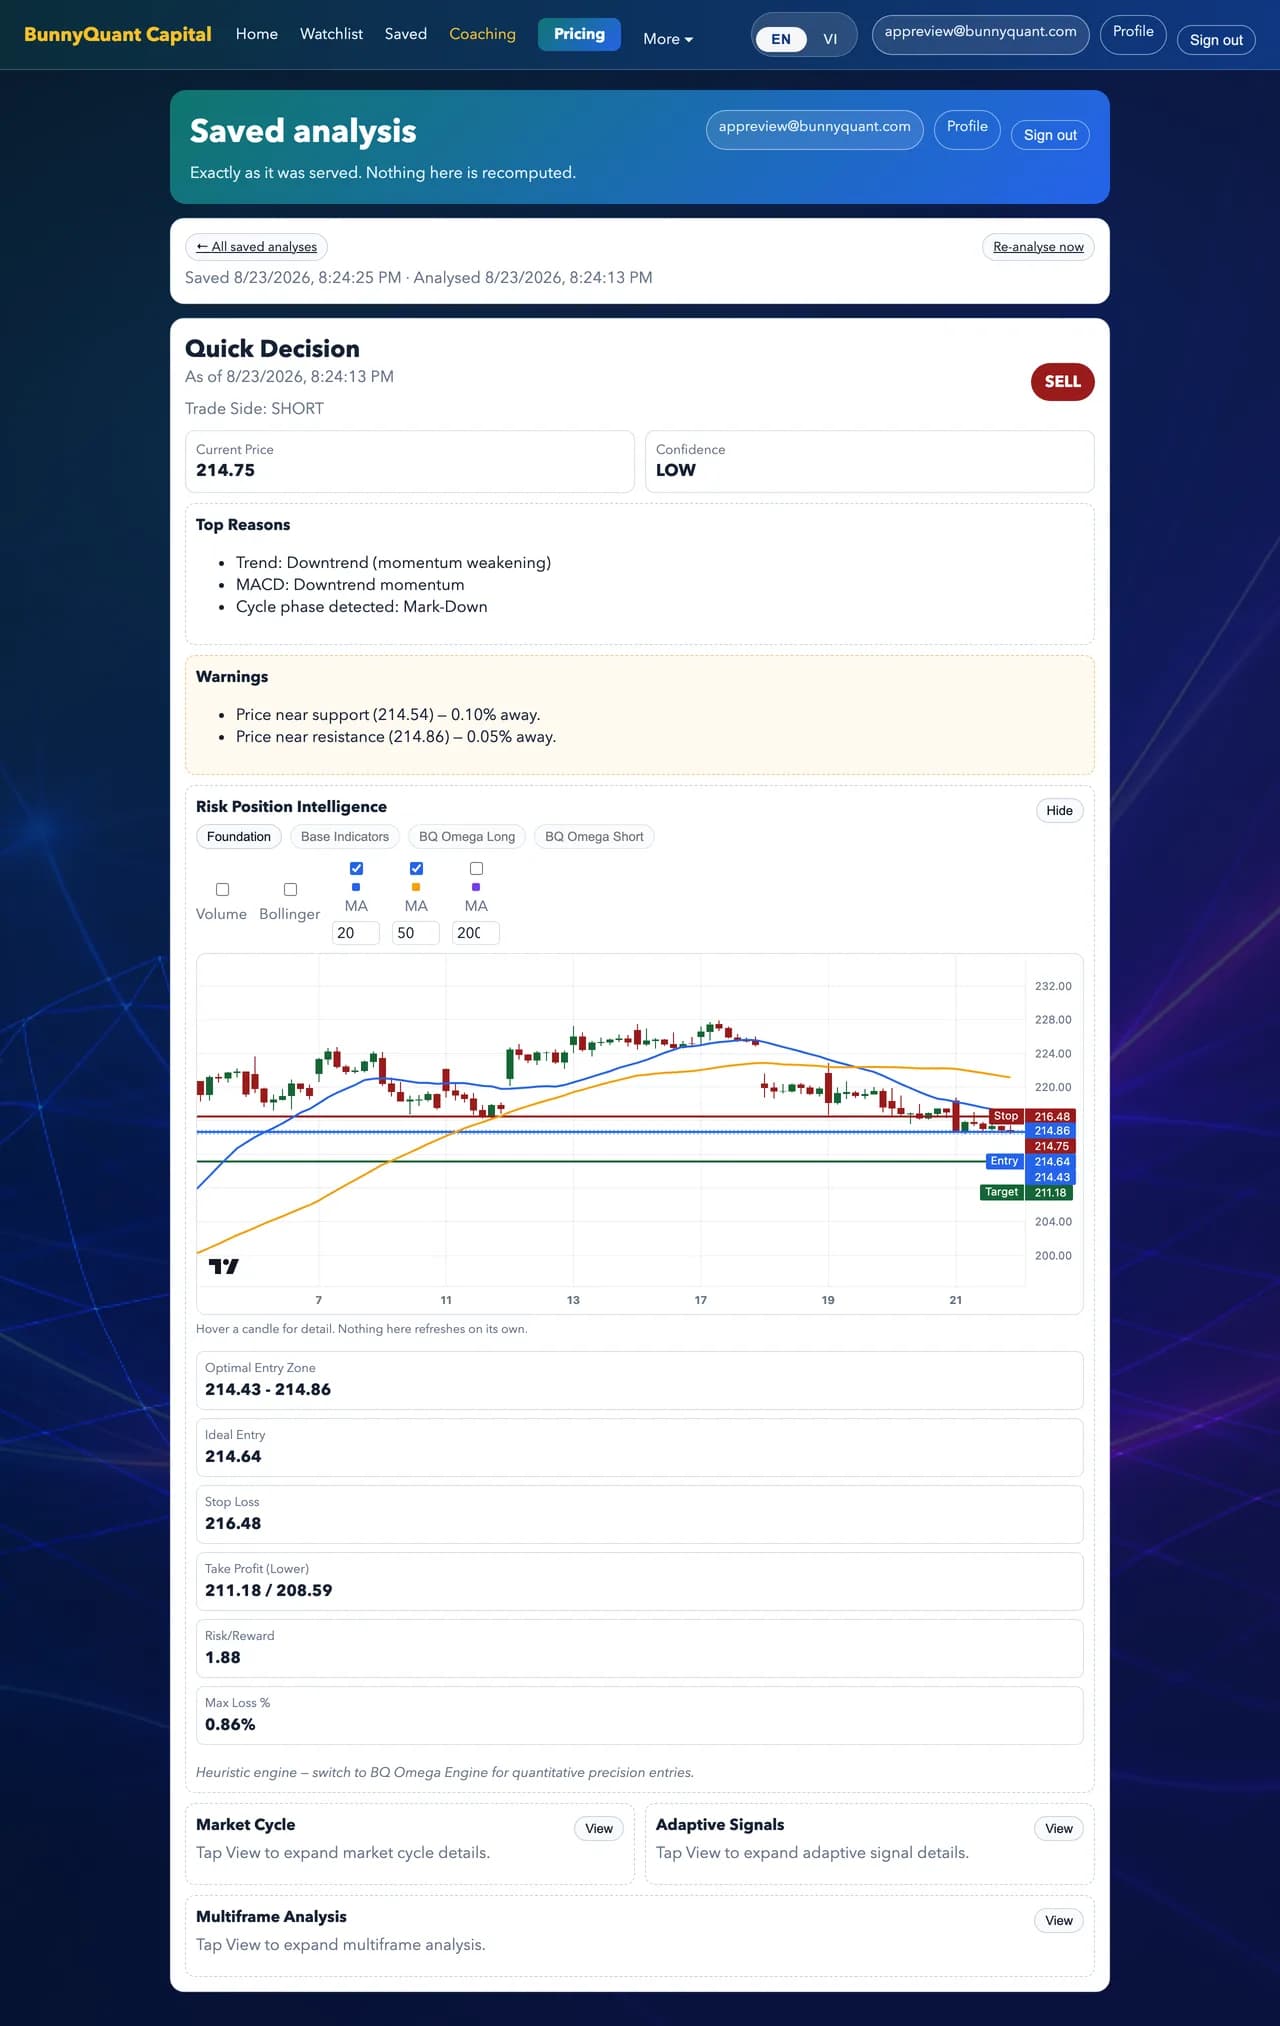
The headline is a direction and a confidence, never a promise. Confidence describes how strongly the simulated outcomes agreed with each other — not how often the system has been right.
Top Reasons lists what actually drove the call. When the reasons contradict each other, that is real information: it usually means the market is between phases, and confidence will be low to match.
- Action
- BUY, SELL or HOLD. HOLD is a real answer, not a failure to decide.
- Trade side
- LONG or SHORT — which direction the setup is built for.
- Confidence
- HIGH / MEDIUM / LOW. Treat LOW as “interesting, not actionable”.
- Top reasons
- The handful of factors that moved the score most.
- Panels below
- Market Cycle, Adaptive Signals, Multiframe and Risk Position Intelligence each open with View.
3. Market cycle
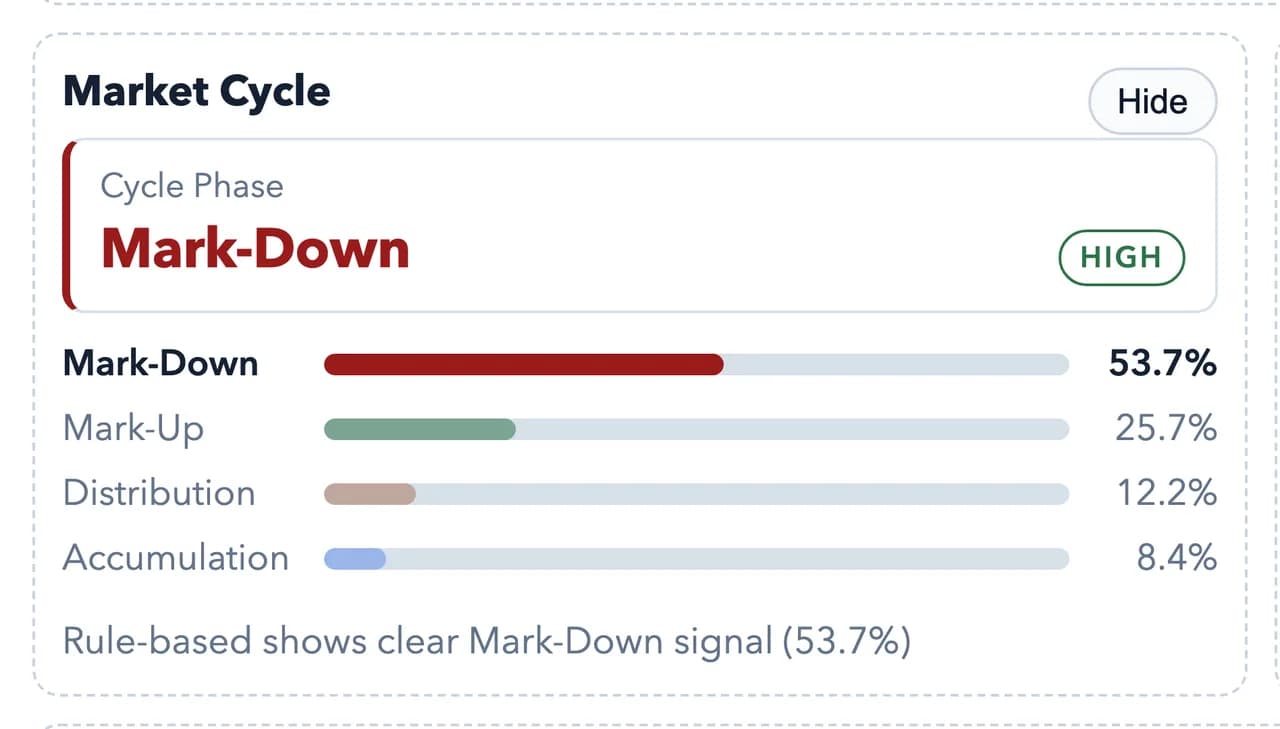
Markets rotate through phases — accumulation, advance, distribution, decline. The same signal means different things depending on which phase you are standing in, so every decision is tagged with the phase it was made in.
A signal that contradicts the prevailing phase is not automatically wrong, but it is a counter-trend trade and is marked as one.
4. Multi-frame agreement
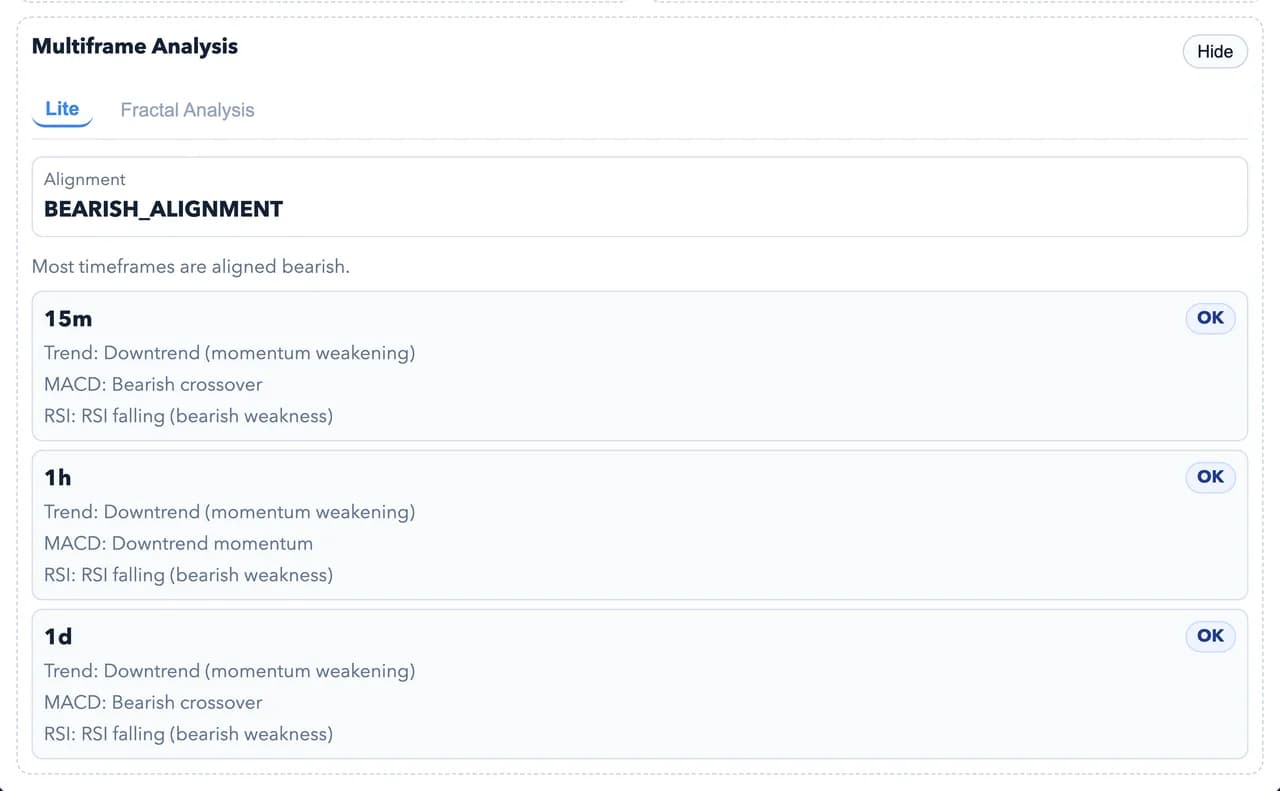
One timeframe is an opinion. This panel checks whether the timeframes above and below are telling the same story before the signal is treated as confirmed.
When the frames disagree, the panel says so. That disagreement is the most useful thing on the screen: it is the difference between a setup with structure behind it and one that only looks good on the chart you happened to open.
5. BQ Omega — position sizing
Omega is the risk layer. Rather than applying a fixed percentage to every trade, it sizes against what happens when the trade goes wrong for this specific instrument.
You choose two things, and both change the numbers below them.
- Confidence level
- How much agreement you require before the setup counts. Higher means fewer, tighter setups — 70% is the working level, 90%+ is rare by design.
- Reward-to-risk target
- How much you want to make per unit risked. 1.0× aims for a target the same distance away as your stop; 3.0× aims three times further. Higher targets are hit less often, so the two settings pull against each other.
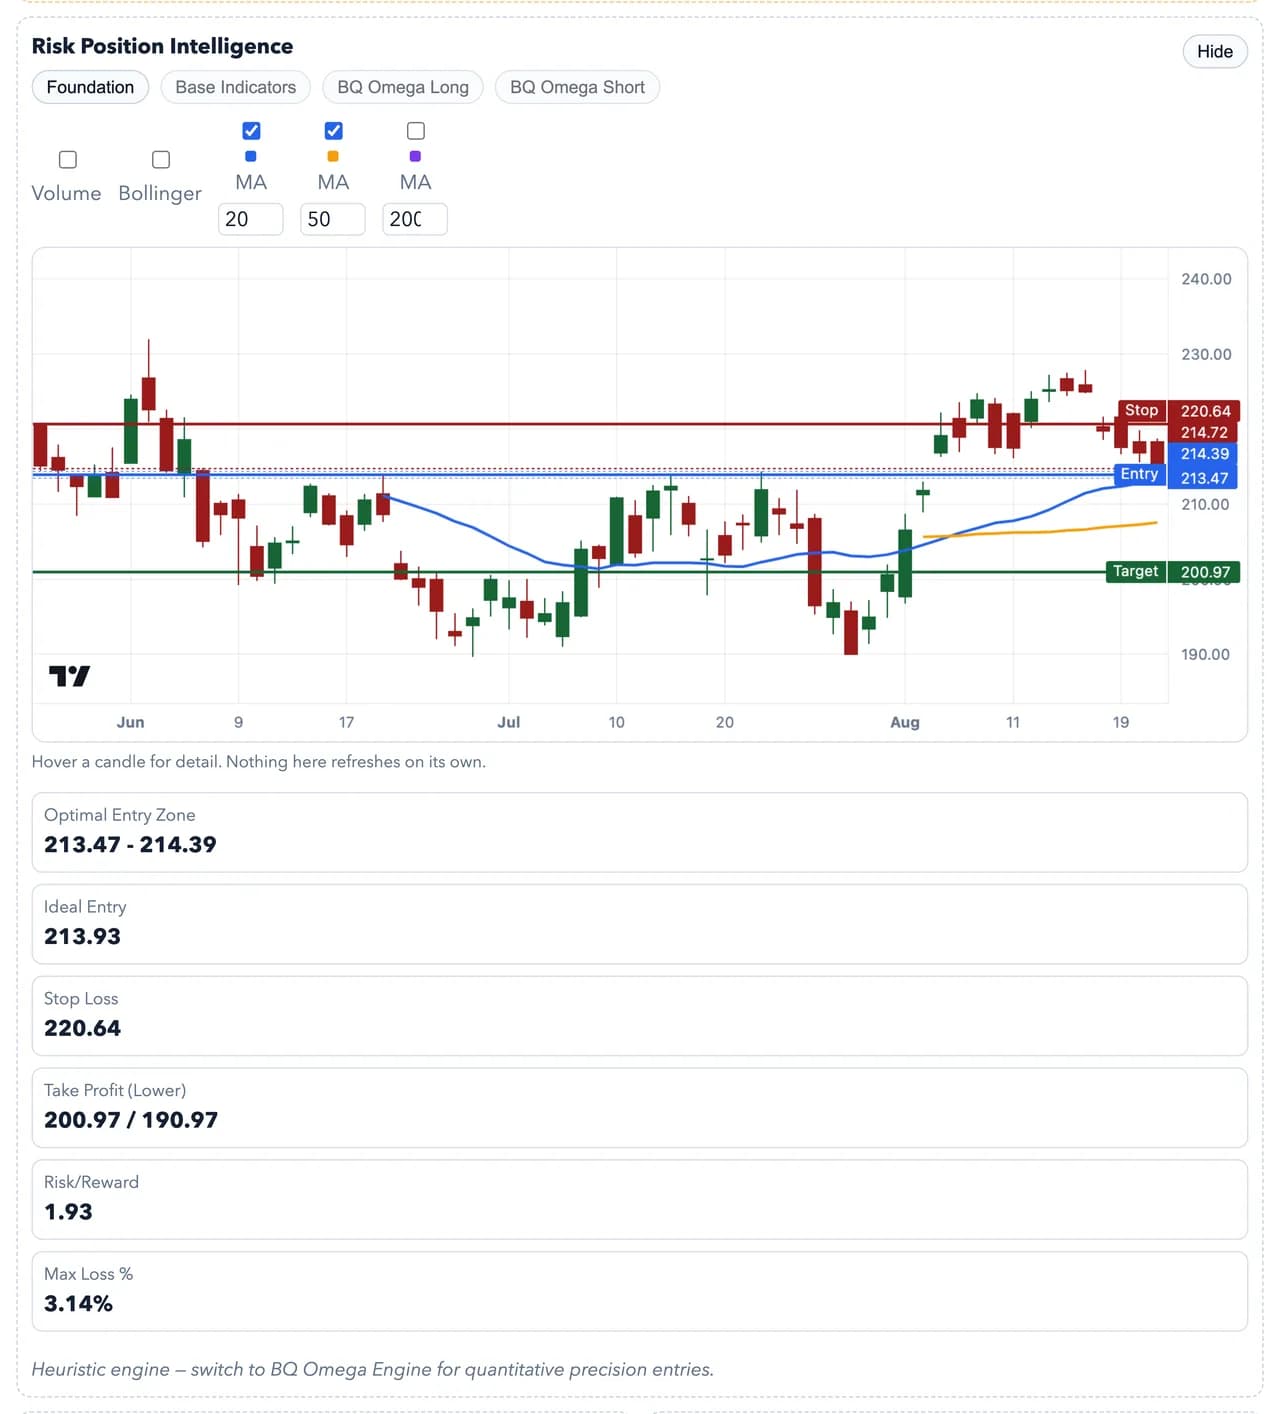
- The chart
- Candles at the interval you analysed, with the three levels drawn across them. The last candle closes on the quote shown beside it — chart and price come from one feed, so they cannot disagree. Volume, Bollinger and the moving averages are yours to switch on; nothing reloads by itself.
- Entry / stop / target
- Prices derived from the pair you chose, not from a fixed formula. Move either setting and the lines move with them.
- Downside and upside tails
- What the bad and good outcomes are actually worth. Size so the bad tail — not the average — stays inside your risk budget.
The screenshot shows one combination. Changing either setting recalculates every number on the panel; the tiers differ in how many combinations you can select, and the top tiers let you set them freely rather than choosing from presets.
6. The other markets
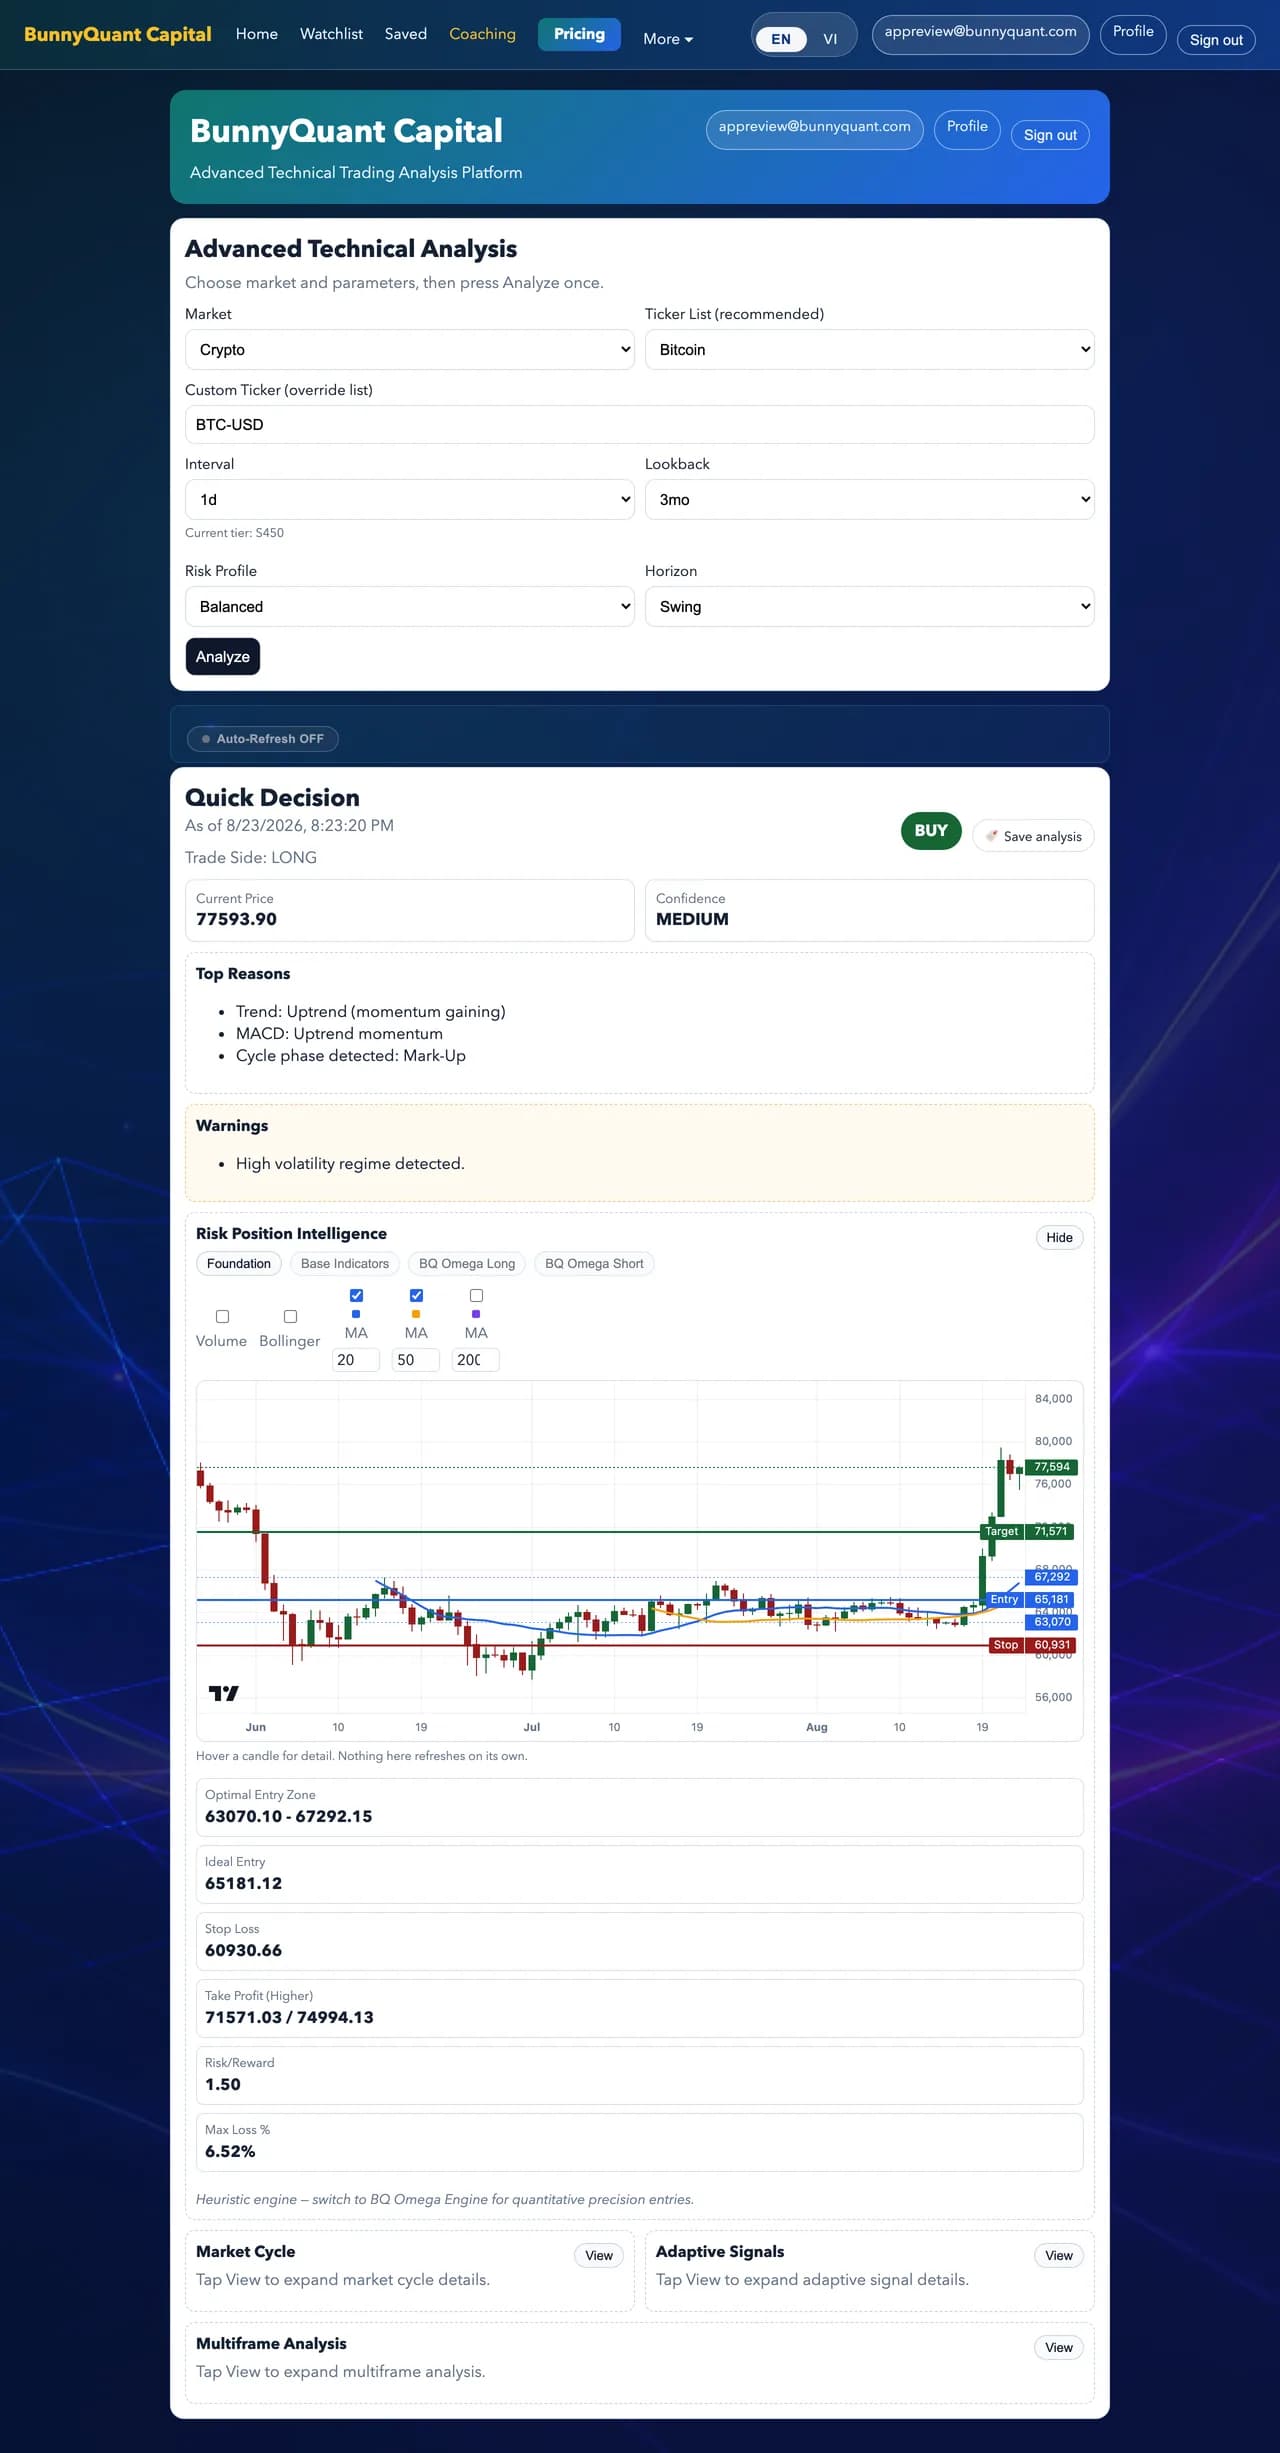
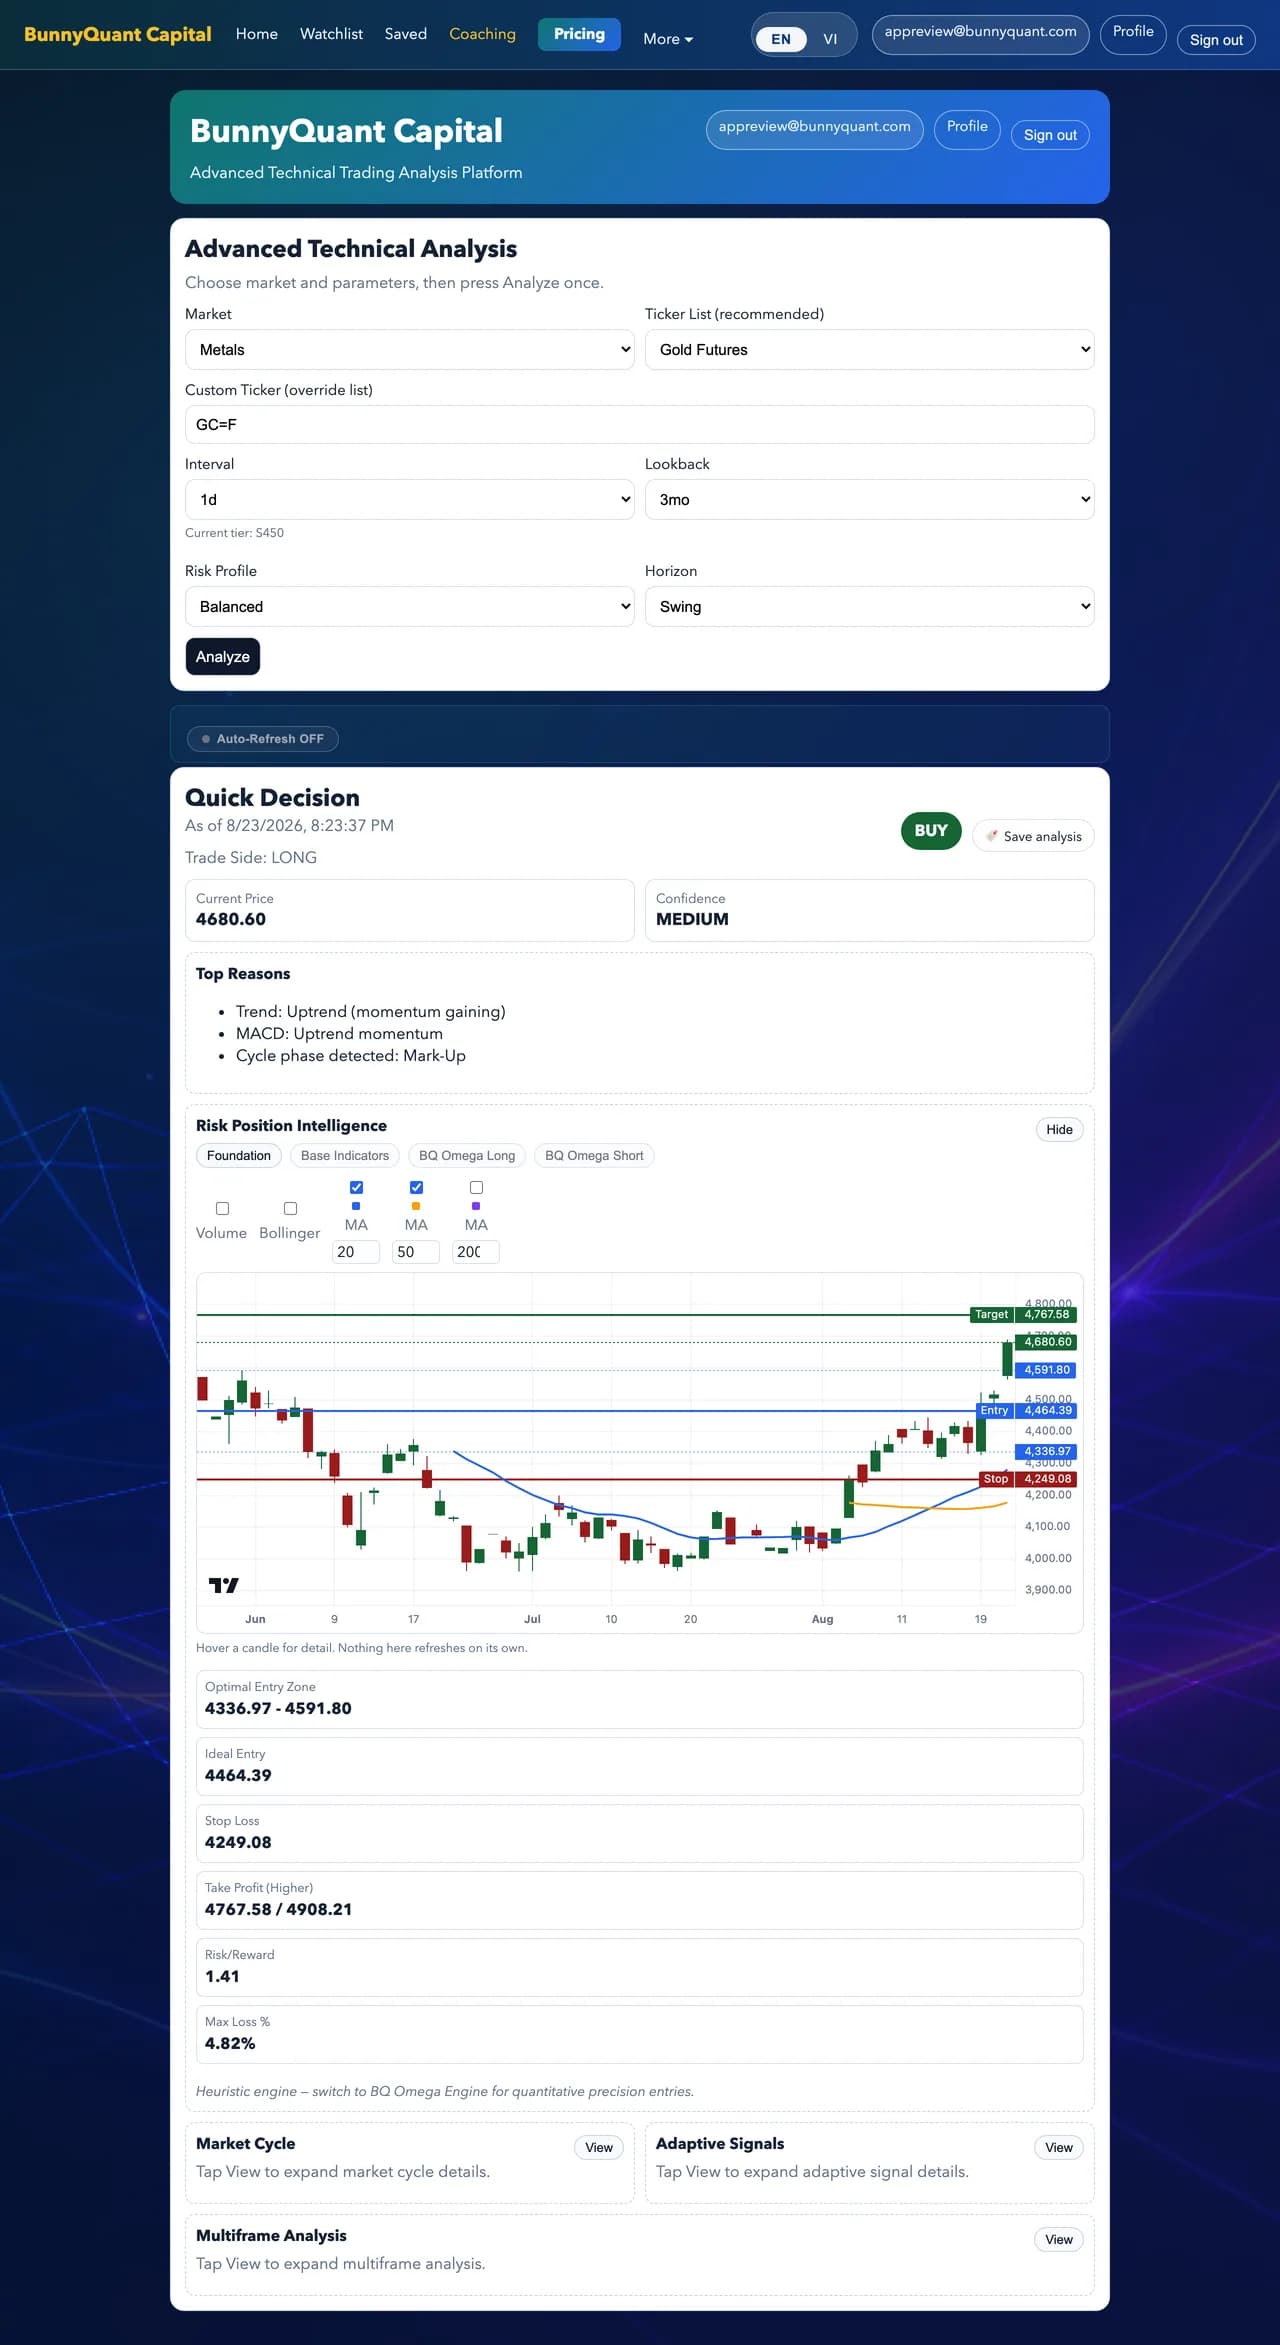
The same analysis runs across every market you have access to. What changes is the instrument, not the method.
US equities, crypto and the index and energy futures are on every plan, including Free. Gold, silver and the other metals are available from E300 upward. Vietnamese equities open at E200, and the Vietnamese indices and derivatives belong to the S450 Vietnam plan.
7. Multi-frame fractal
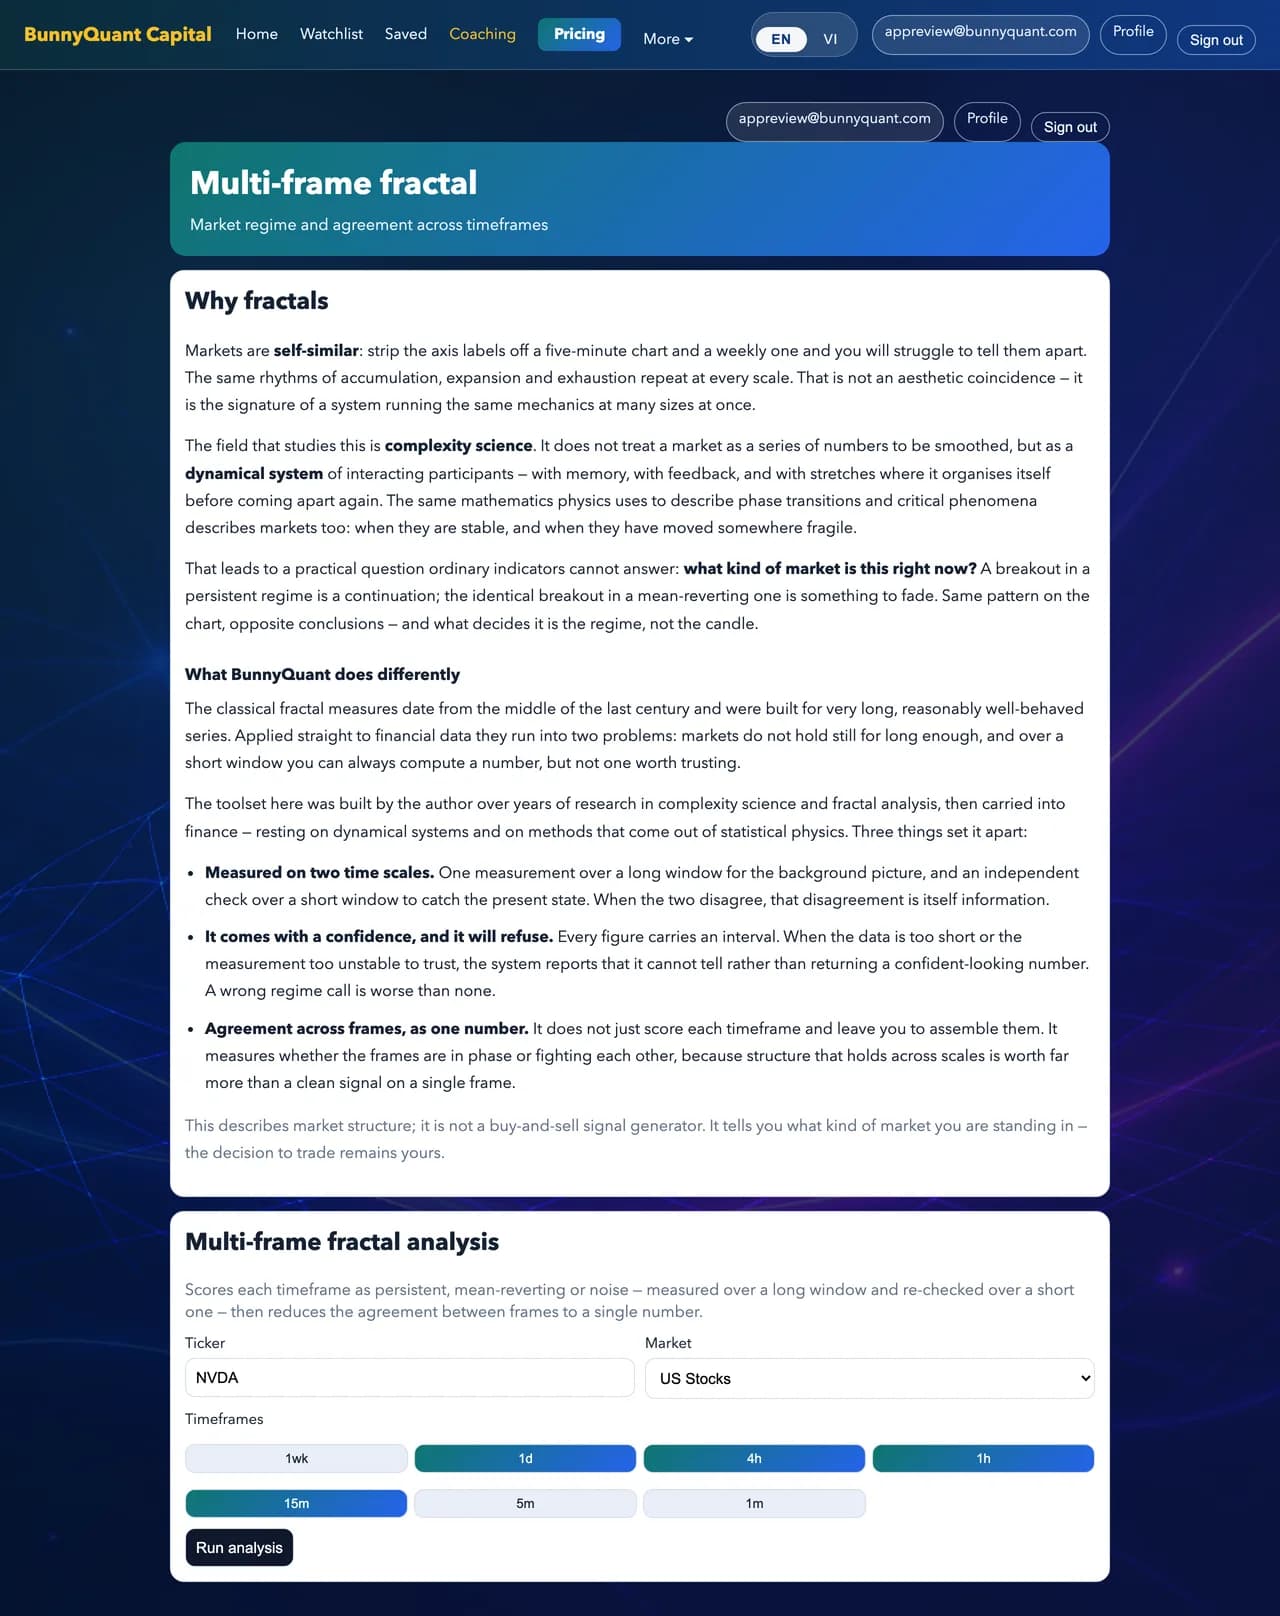
A deeper read of market structure: whether each timeframe is trending, mean-reverting, or indistinguishable from noise, and how strongly the timeframes agree.
It reports when it cannot tell. A blank is not a bug — a wrong read on market regime is worse than no read.
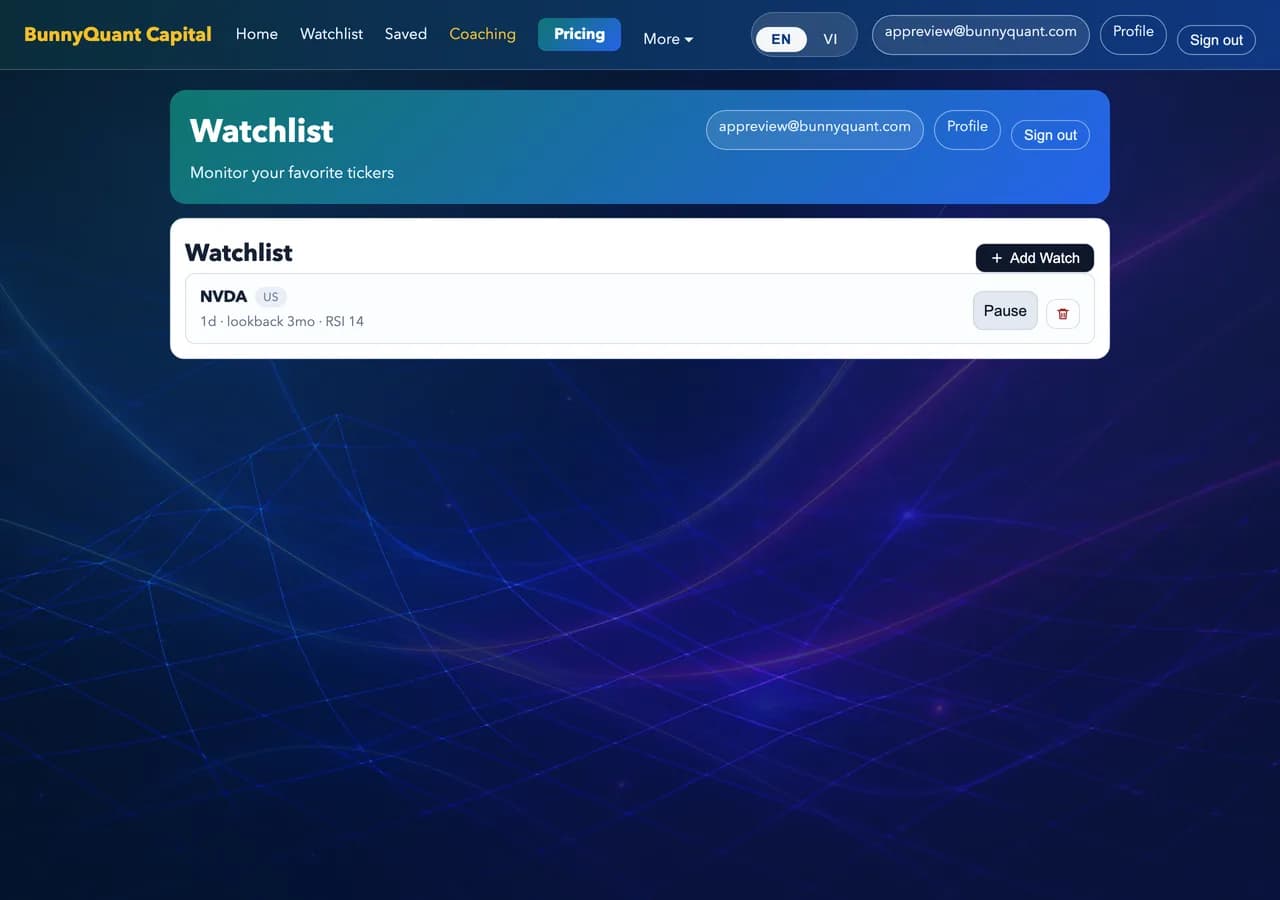
8. Watchlist
Save the instruments and timeframes you follow so you are not retyping them every session.
9. Saved analyses
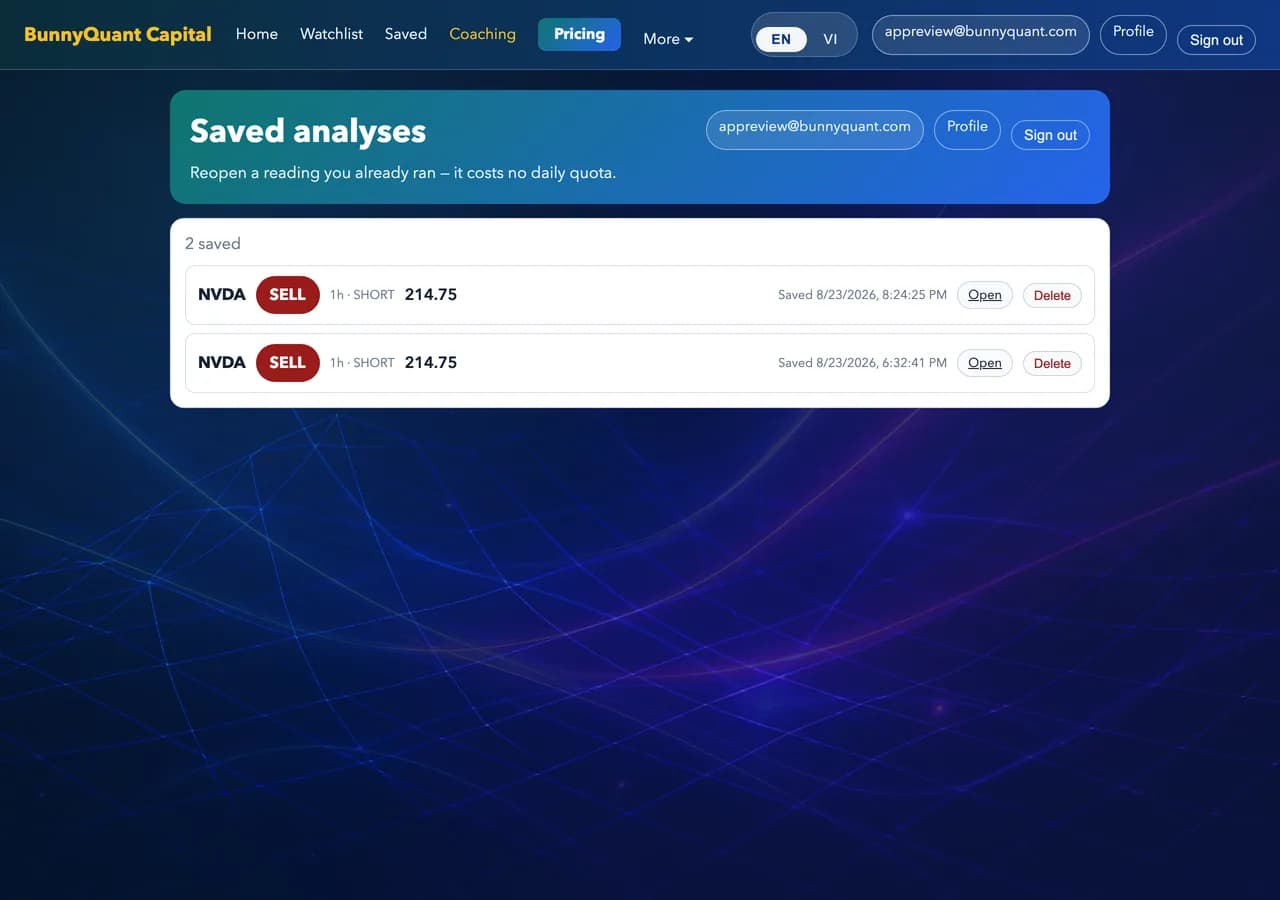
Press Save beside the verdict and the whole analysis is kept — the symbol, the moment, the levels, the chart. Reopening it later costs none of your daily quota, which is the point: you should not pay twice to look at a reading you already ran.
What is stored is what you were served, not a fresh calculation. Open a snapshot from last month and you see what the system said last month, even if the method has changed since. That is what makes comparing across time mean anything.
- Saving
- Available from C-Class upward. The number you can keep depends on the tier; delete an old one when the list is full.
- Reopening
- Nothing on that page recalculates. Panels you had not opened when you saved are marked as not part of the snapshot rather than offering to compute them now.
- Re-analyse
- A link back to the form with the same inputs. It runs a fresh analysis and spends a credit — deliberately a separate decision.
10. Plan and account
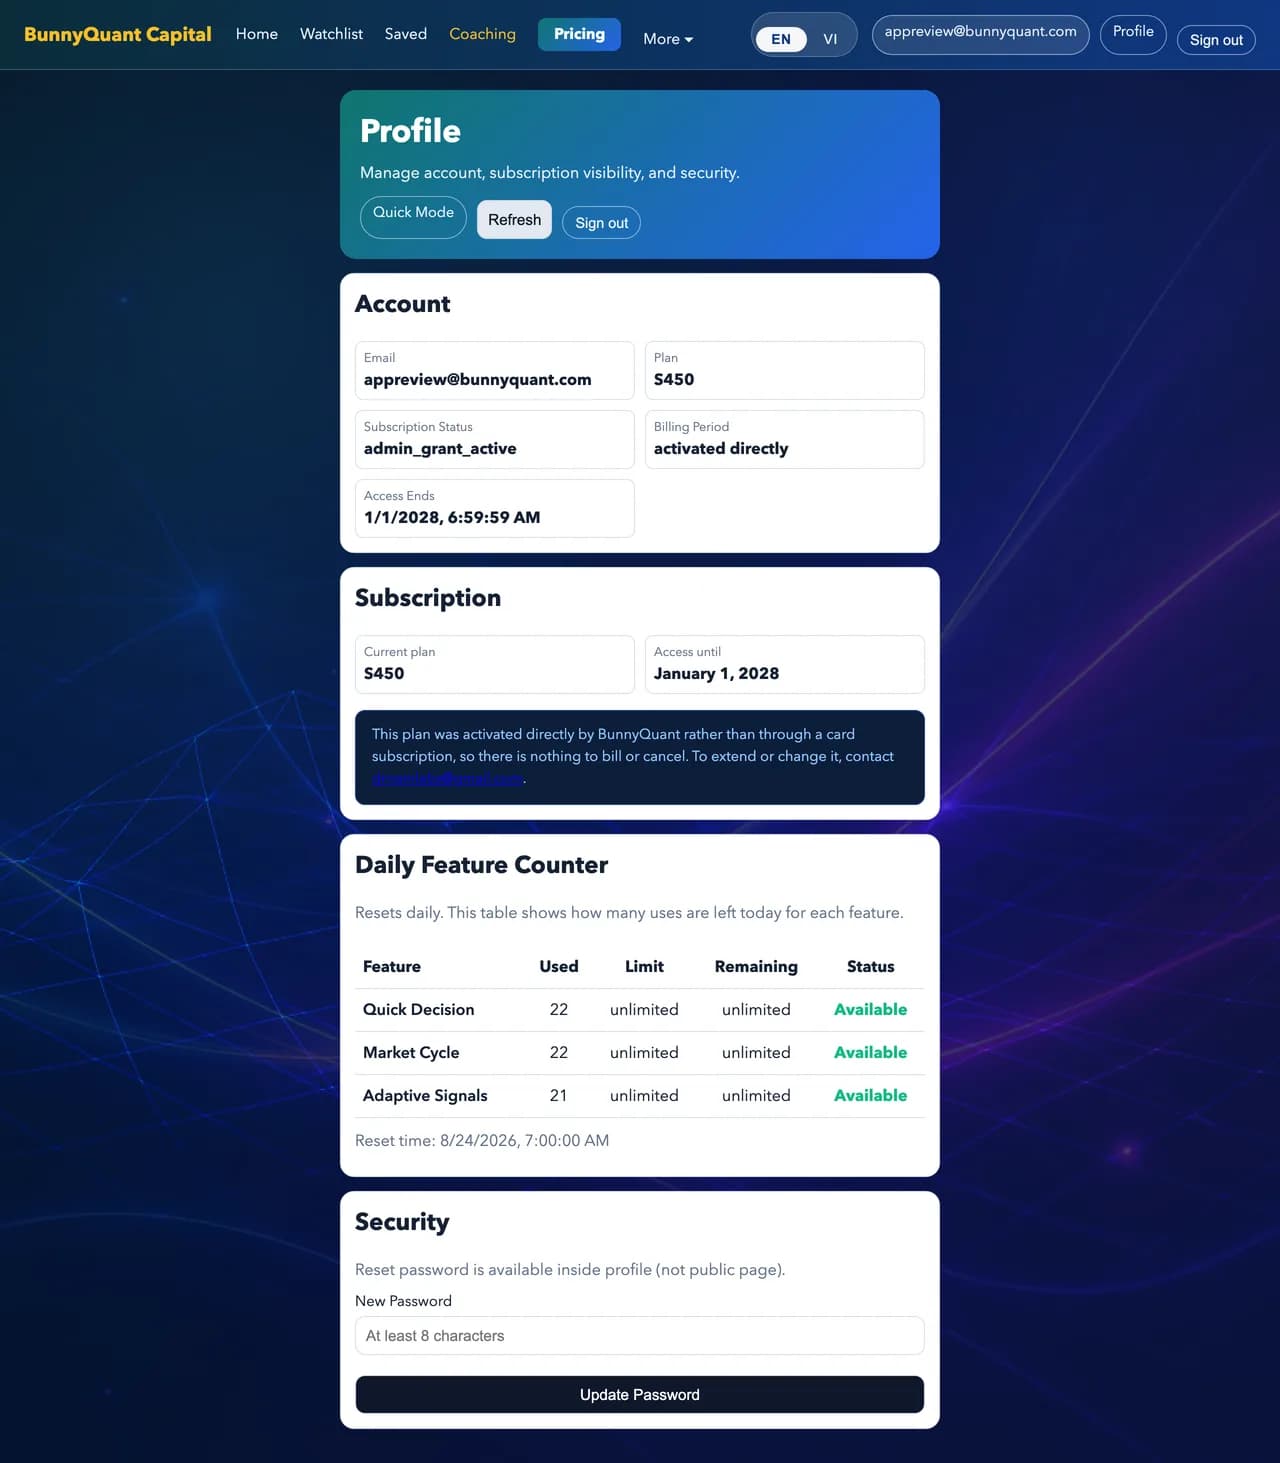
Your profile shows the current plan, the daily counters, and where to change your password. The Subscription card is where you upgrade, downgrade or cancel.
Upgrades take effect immediately and you are charged only the difference. Downgrades and cancellations take effect at the end of the period you have already paid for — nothing is lost by deciding early.
11. Short signals
Shorting is harder than buying, and the reason is built into the trade itself. When you buy, the most you can lose is what you put in: price cannot fall below zero. When you short, there is no ceiling: price can keep rising, and so can the loss. A short has no natural floor under the damage.
That makes risk management the whole game on the short side. The stop has to be decided before entry and respected, the position sized so the bad case stays inside your budget, and overnight gaps planned for, because one surprise can move price past the stop before it can fill.
So BQ Omega Short is a more advanced model than the long side, not the long side turned upside down, and it takes considerably more computation to produce.
Short signals are a paid part of the platform: included from E300 upward, within each plan's allowance, with more available to buy when you need them.
- Free shorts
- The shorts included in your plan. They reset daily at 07:00 Vietnam time and have a monthly cap of 20 trading days. E300: 5 a day. E350 and E400: 20. S450 and VNF: 30. S550: 50. S650 and Maybach: unlimited. Plans below E300 have no short signals.
- Timeframes
- On plans below S550, free shorts cover the 1h, 4h and 1D timeframes. Shorts on smaller timeframes need a paid short or the S550 plan and above.
- Paid shorts
- Bought with BQ Wallet points: 50,000 VND each or 500,000 VND for 10, topped up by QR inside the short tab. They are for the same day and separate from your free shorts; buying them does not bring free shorts back sooner.
- What counts as one
- Opening the short tab for a symbol and timeframe uses one. Reopening the same symbol and timeframe that day, including with Auto-Refresh on, does not.
- Foundation tab
- When the decision is SELL, the short trade plan (entry, stop, target) appears only in BQ Omega Short, where it uses a short from your allowance.
- Where to check
- The Shorts card on your Profile shows how many free and paid shorts you have left and exactly when free shorts return.
What this guide does not cover
How to combine these readings into a trading decision, how to size across a portfolio, and how to tell a genuine setup from a plausible-looking one. Those are judgement, not features, and they are what the coaching programme is for.
Anything unclear: drnamlabs@gmail.com
BunnyQuant is built and run by one person. Everything you are reading here is free. ♥ Support the project